Dashboard Overview
What Is A Dashboard
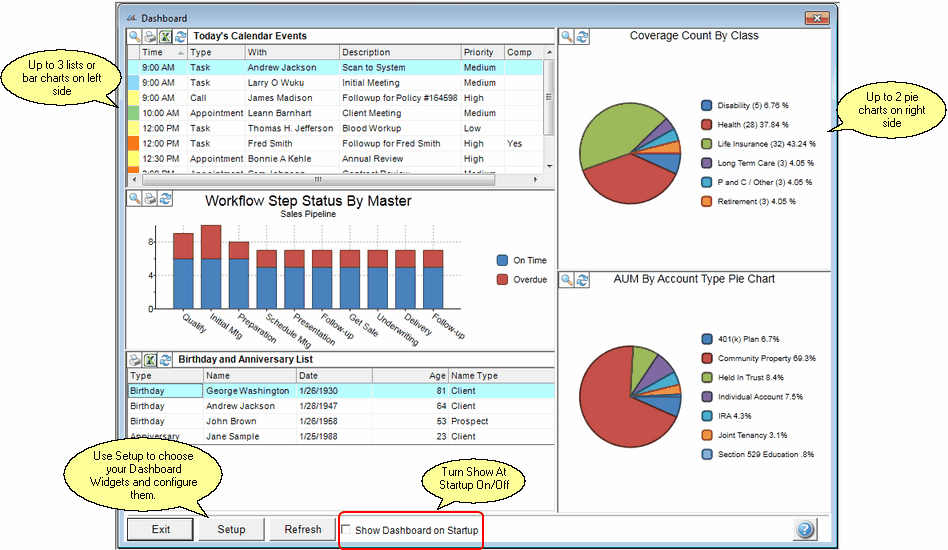
A dashboard is a place where data is summarized in a format which is easy to read and understand. It's designed to show you things and help you with what you are doing.

Typical Dashboard Configuration
It's called a dashboard because it's like an instrument panel. However, CRM database information does not lend itself to instruments with pointers, like a fuel gauge. Therefore our dashboard uses the following "instruments:"
| • | Pie Charts |
| • | Bar Charts |
| • | Sortable Lists |
Advisors Assistant's Dashboard Features
Here are some of the features of the Dashboard:
| • | User selectable Show On Startup |
| • | Long list of Widgets that individual users can choose from. |
| • | Automatic integration with Workflows with management overviews. |
| • | Automatic Integration with Calendars |
| • | Automatic Integration With Insurance Production |
| • | Automatic Integration With Investments |
| • | Each Widget can be custom configured to meet individual users' needs. |
| • | Instant reports right from the Dashboard by clicking on a chart section. |
| • | Export of lists to Excel Spreadsheets. |
| • | Refresh buttons to bring in up to date information. |
| • | News topics through RSS Feeds with a built in RSS Reader. |
| • | Easy to use and configure. |
A widget is a small, isolated segment of an application that is designed to perform a particular task. In the case of the Advisors Assistant Dashboard, each part of the Dashboard is composed of a "Dashboard Widget" which performs the task of getting and displaying the data for that part of the Dashboard.
On Demand VS At Startup
The Advisors Assistant Dashboard can be configured to show at startup, on demand, or both.
|
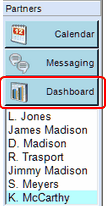
The Dashboard is available "On Demand" by clicking on the Dashboard Button from any View Screen. When you click on the Dashboard Button, the Dashboard will load and various totals and values will be calculated, with the exception of updating any investment asset values. See the help topic Updating Investment Values for more information about those values. Using Startup Option If you elect to display the Dashboard at startup, it may take longer to display the Dashboard Screen since the system will be initializing itself and then calculating the various totals and counts needed for the Dashboard. Use the small checkbox at the bottom of the dashboard screen to elect the Show Dashboard At Startup Option
|
Refresh
The data displayed on the Dashboard is representative of the data stored in the database at the time the dashboard is displayed. When other users are changing and adding data, it is not automatically updated on the dashboard display because this would cause a tremendous strain on your server constantly updating the dashboard.
The Refresh Button will update your dashboard data.
Dashboard Screen Resizing And Scaling
You can scale the Dashboard Screen, but only to the point where the height fills the screen. The ratio of the Height to Width (Aspect Ratio) cannot change or the charts and graphs will be distorted.
To change the size of the dashboard screen, drag the edge or corner with the mouse. Depending on your processor speed, the scalling will drag slowly.
Setup
Use the Setup Button to change the change the configuration of the Widgets you are displaying or to swap widgets in and out of your dashboard.
Transactions are not normally processed to update market values until you print a report or look at the data on one of the view screens. Therefore, the Investment data shown on the Dashboard will not normally be totally up to date.
To bring the investment data up to date, you need to calculate all of the transactions in your system, and this can take some time.
To update your AUM (Assets Under Management) you should Calculate Investment Values from the Investment Utilities Menu, leaving all of the check boxes unchecked.
Note: The process of recalculating all of the market values of your investments can take from several minutes to a few hours, so it should be started and left to run at night. The amount of time depends on the number of accounts and the number of transactions in your database.
RSS stands for Really Simple Syndication. It's a way to deliver up to date information, but takes a special "RSS Reader." Your Dashboard has an RSS Reader built in. It can provide up to 3 different RSS Feeds.
RSS Feeds are topics that you can click on to read the underlying news article. Clicking on the RSS Topic on the Dashboard will take you to the article on the web.
Use the Setup Button to put the RSS Reader on your Dashboard. You can see more about how to set up the feeds in the setup help for the RSS Reader.
See Also
Updating Assets Under Management For Producers

