Excel Graph Example
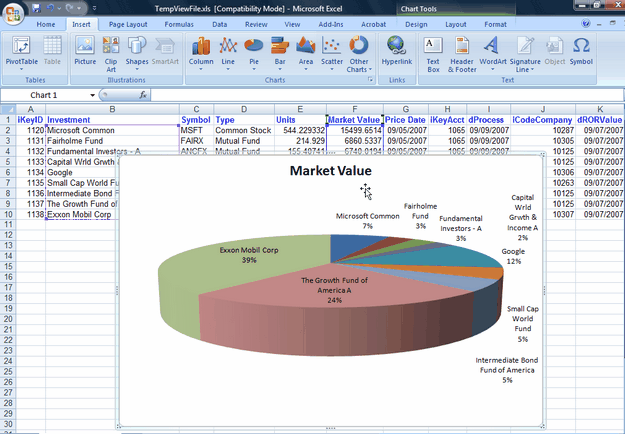
The following graph was created with Excel 2007, but other versions of Excel can do virtually the same thing.
From the View Account With Investments Screen, click the Excel Button. Then the two columns (B and F) were highlighted and the Insert Tab was clicked to insert the graph.

Of course, titles, colors, type of graph, etc. can all be customized.
