Customizing Reports

Contents
This is accessible only by users who have rights to add and modify basic reports. Click on the Admin Menu / Report Designer and then click on the Add or Modify Button from the Report Maintenance Screen.
![]() Creating Custom Reports Tutorial (9:19)
Creating Custom Reports Tutorial (9:19)
Customizing Reports Overview
Advisors Assistant comes with the Basic Report Designer, which allows you to add your own Custom Reports, or modify a report that has been designed using the Basic Report Designer.
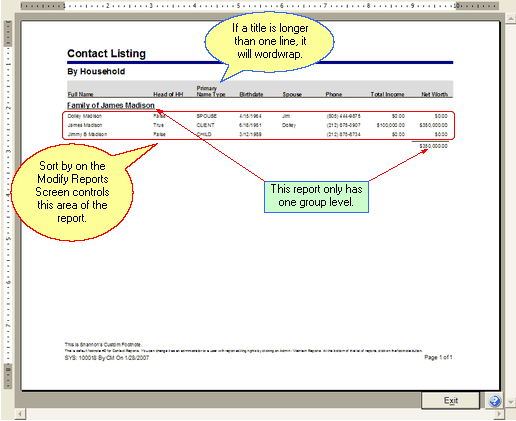
The report below was printed based on the design shown above.
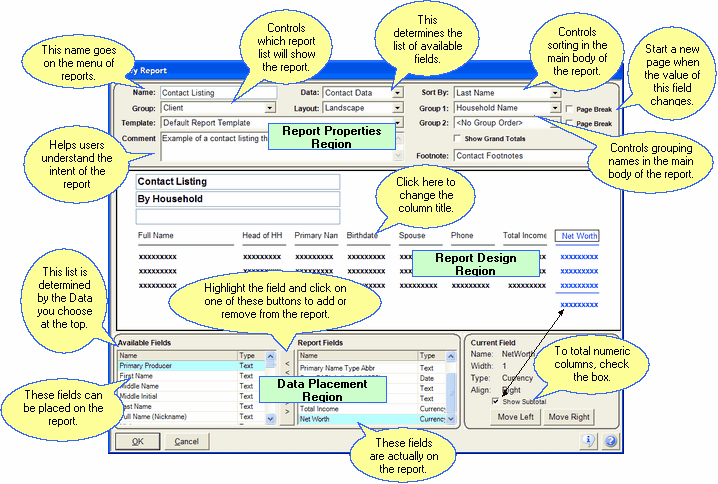
The Modify Reports Screen allows you to design new or change existing Basic Reports. The screen is divided into 3 major regions:
The Report Properties Region at the top
This is where you choose what data will go onto the report, the report list where it will be available, and other properties (or attributes) of the report. Each field in this region is explained in more detail below.
The Report Design Region in the center
This area shows the columns of the report and which columns will contain the data you select.
The Data Placement Region at the bottom
This area lets you select the fields to be placed on the report by moving the fields between the two windows.
Details about each field for the Data Selection Region are below:
Name
This is the name of the report as it will appear on the reports menu. If you made a copy of a report and are then modifying the copy, you can rename the report. Changing the name of the report will not affect the report's content. The name should be descriptive so that the user will know what to expect from the report.
Examples
Contact List Sorted By Postal Code
Investments Grouped By Account Number
Insurance
The third example, above, doesn't tell you much about what is on the report - be descriptive!
Group
The Group determines on which report list it will be available. Select from the list. Normally the Data and Group entries will coincide, but they don't have to.
Examples
Client
Investment
Insurance
New Business
Template
Templates determine how the report appears on the page. Margins, fonts, and title placement are all controlled by the template. A default template is delivered with the system. Other templates may be added from time to time. The Advanced Report Designer allows for the addition and changing of templates, but this is not encouraged.
If you have the Advanced Report Designer, recommended for people who have used report designers, you can change and add templates. Client Marketing Systems, Inc. can also design custom templates for a nominal fee.
Comment
This field appears on the Report Menu and is designed for the report designer to communicate to the users the purpose of the report or when to use it.
Footnote
Use this drop down list to choose which footnote you want to appear on the report. Footnotes are stored in the database and can be modified by those with access rights. Footnotes are modified by clicking on Footnote on the Report Maintenance screen.
Examples
No Footnote
Contact Footnotes
Investments
Data
This is an important field because it determines what data fields will be available to you for the report. Since there are thousands of fields of data, we've divided them into various categories. It would be unusual to want to put the insurance modal premium on a standard list of contacts, so we've created these sets of data.
Examples
Contact
Investment
Policy and Coverage
Layout
You have two choices, Portrait and Landscape. When you choose Landscape, more columns are available for the data.
Sort By
You must choose the Data before you can choose what to sort by. The sort order determines how the list is displayed. It works with the Group fields to sort and display the data.
Examples
Last Name
City
ZipCode
Group1 And Group2
Groupings are are used for Sub Headings. If you choose a grouping, such as Gender, the report will show a Sub Heading of Male and then all the male clients will be listed under that Sub Heading. If you chose a second group by City, then all the males from Los Angeles would be listed together.
Example
Sort Order = Last Name; Group1 = Gender; Group2 = City
The report would look like this:
Female
Phoenix
Gina Davis
Mary Mayfield
Male
Los Angeles
Tom Jones
Harry Smith
New York
James Madison
John Sample
The groups are automatically sorted alphabetically, so Females are listed before Males and Los Angeles comes before New York (within it's group of Males).
The Sort Order of Last Name controls how the detail data is listed within the cities. Jones comes before Smith in the group of Los Angeles clients.
You'll probably need to experiment with sorting and grouping to understand just how it works.
Page Breaks
If you want to start a new page after a grouping, just check the box next to the group.
Available Fields
The available fields list depends on what you select in the Data field. If you select Contact Data, the list of available fields will be those fields associated with contacts.
Highlight any field on the Available Fields list and click on the >> button to the right of the list to place the field on the report.
Report Fields
When you place a field on the report by highlighting a field on the Available Fields list and clicking on the >> button, it becomes a Report Field and it's placed on the report.
It can be removed from the report by highlighting the field on the Report Fields list and clicking on the button with the << on it.
Show SubTotals
Numeric and currency fields can be sub totaled by clicking the Show Subtotal field on the lower right.
Move Left & Right Buttons
You can move a field to the left or right by clicking on the field in the Report Design Region (center of the screen) and clicking on Move Left or Move Right.
Click OK to save the report back into the SQL Database and then click Exit so you can run the report. The quickest way to run a report is to use the Current Client Button on the Menu Bar. If you're viewing a client with the information that will be on the report, you can see the layout and lineup pretty easily. Then when you have the report pretty well designed, you can start using the selection report criteria to put more information on the report.
|
Put one or two fields on the report and then click OK and run the report to see how it looks. You may want to change your sorting or grouping. The grouping fields will be placed on the report automatically, so you don't have to make them one of the Report Fields. |
See Also