Dashboard Screen
Click on the Dashboard Button on the Menu Bar near the bottom left of the screen.
Your Dashboard
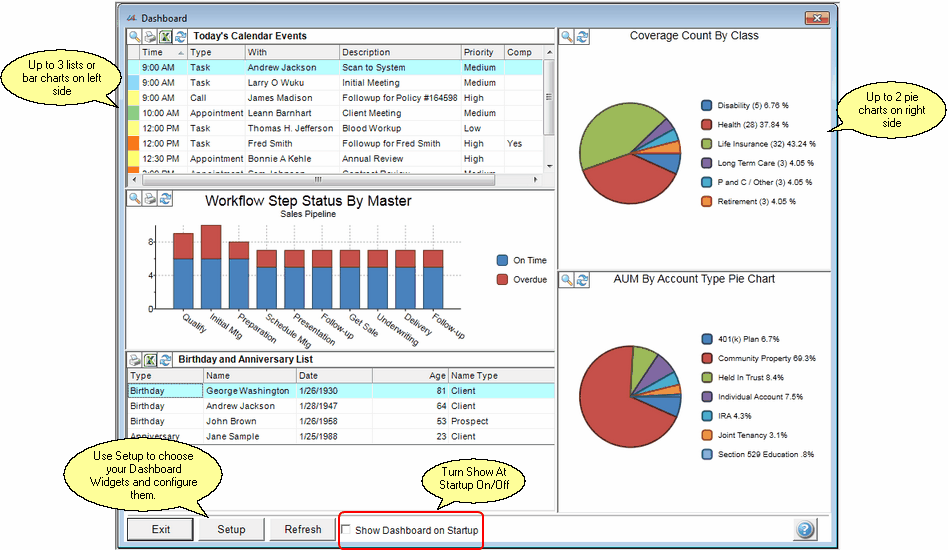
Each user can customize their own dashboard. Managers will certainly want different Dashboard Widgets than someone processing new clients. Advisors Assistant has a wide variety of Dashboard Widgets and will add more from time to time.

Each User Has Their Own Dashboard
The size of the pie chart depends on the length of the legend descriptions. If the Account Type Descriptions are very long, the pie chart shown will be small.
To make the descriptions more concise, use the Add / Modify Abbreviations Screen.
Dashboard Functions
There are several functions available to you from your Dashboard. It is not just a static display of data. Below is a list of those functions and how to perform them.

Widget Function Buttons
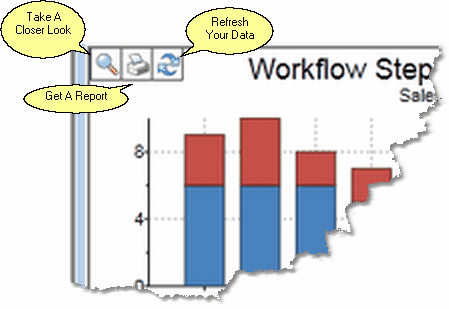
Take A Closer Look ![]()
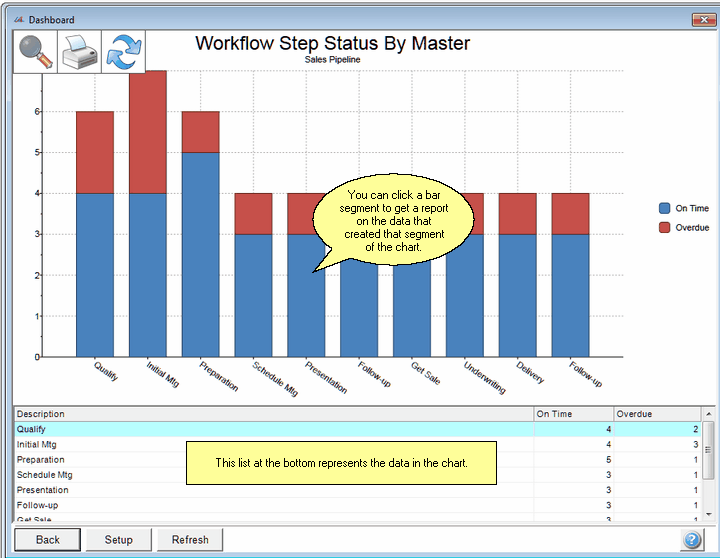
Clicking on the magnifying glass will take you to a full screen view. Depending on the type of Widget, the graph segments are "live" and will provide you with a report when you click on them.

Typical Expanded View Of A Bar Chart
Get A Report ![]()
You can click on the report icon on the chart in the normal or expanded view to select all of the data used in the chart.
Refresh Your Data ![]()
Excel Export
When you see the Excel Icon, you can click on it and export the list to an Excel where you can sort and print the list.

Excel Export Available On Many List Widgets
Clicking on the slice of the pie will select the data that was used for that slice and take you to the Advisors Assistant report menu for that area of the program.
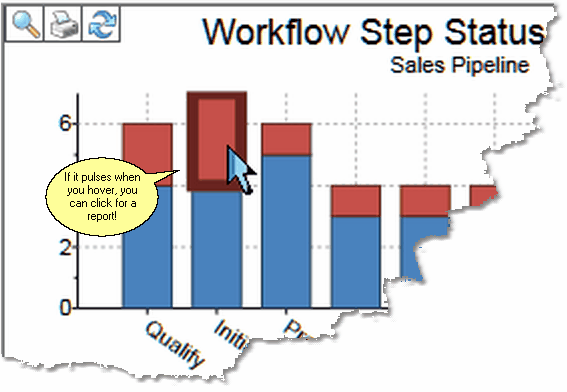
Bar Chart Hover Report
When you hover over one of the bars of a bar chart, and it pulses, you can click on that section of the bar and get a report that selects ONLY the data represented by that bar.

Hover Over A Chart Element
Pie Chart Hover Report
Clicking on the slice of the pie will create a report based on the data used ONLY for that pie slice.
The setup button will let you:
•Choose which Dashboard Widgets to put on your Dashboard.
•Configure the individual Dashboard Widgets, customizing them for your specific way of doing business.
See Also
|
When entering an organization's name, if it is a joint account, enter the last name first, such as Smith, John and Jane. This makes it much easier to locate by last name. |
