AUM By Sector Pie Chart

Contents
Click on the Dashboard Button on the Menu Bar near the bottom left of the screen. Then click on the Setup Button at the bottom of the Dashboard. Click on the active widget you want to set up and then click the Setup Widget Button.
Assets Under Management (AUM) Overview
This set of Dashboard Widgets measures the Market Value of the assets by Sector of investors for which the user has access. In the case of Multi-producer systems, the user may not have access to all of the accounts.
What You Need To Know About AUM Calculations
Every account is not updated every day when prices change because of the time involved in recalculating. We use a concept called Just In Time Calculations so your computer only uses the time to calculate market values when you need them. Then they are stored in the asset and account records. The AUM shown uses these market values.
There is a utility called Calculate Investment Values under the Side Bar Investment Utilities Menu that will Recalculate all of the market values or all for a single producer. This can be used to update the market values for the dashboard, but should be run during a time when you can leave it run from several minutes to an hour or more, depending on the number of accounts. As the help topic indicates for that screen, leave all the boxes unchecked so you are not making more calculations than needed.
AUM By Asset Sector Pie Chart
This pie chart will show what percentage of assets under management are in each asset Sector. Zoom in on the chart to see dollar amounts on the legend.
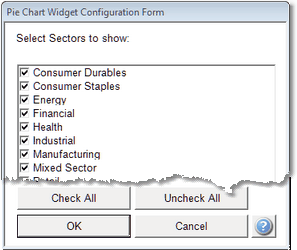
It is recommended that you only check about 10 of your top asset types so that you don't get information that is not meaningful.
See Also
Update Investment And Account Values