View Client With Investment Accounts

Contents
Click on the Investments Tab at the bottom of any View Client Screen.
![]() View Client With Accounts And Investments (9:50)
View Client With Accounts And Investments (9:50)
![]() Getting Started - View Screen Tour (7:53)
Getting Started - View Screen Tour (7:53)
View Client With Investment Accounts Overview
Advisors Assistant gives you the ability to track any type of unit based investment, and to store all of your client's investments in one location. You'll have quick access to the details of each account and the individual investments within the accounts. There are also a variety of reports, including Performance Reports, that you can print.
The View Client With Investment Accounts Screen shows you a summary of all of the accounts that have been added to this client's record. Some basic information about the accounts is shown on this main View Screen, but much more detailed information is also available for each account and each investment within the accounts.
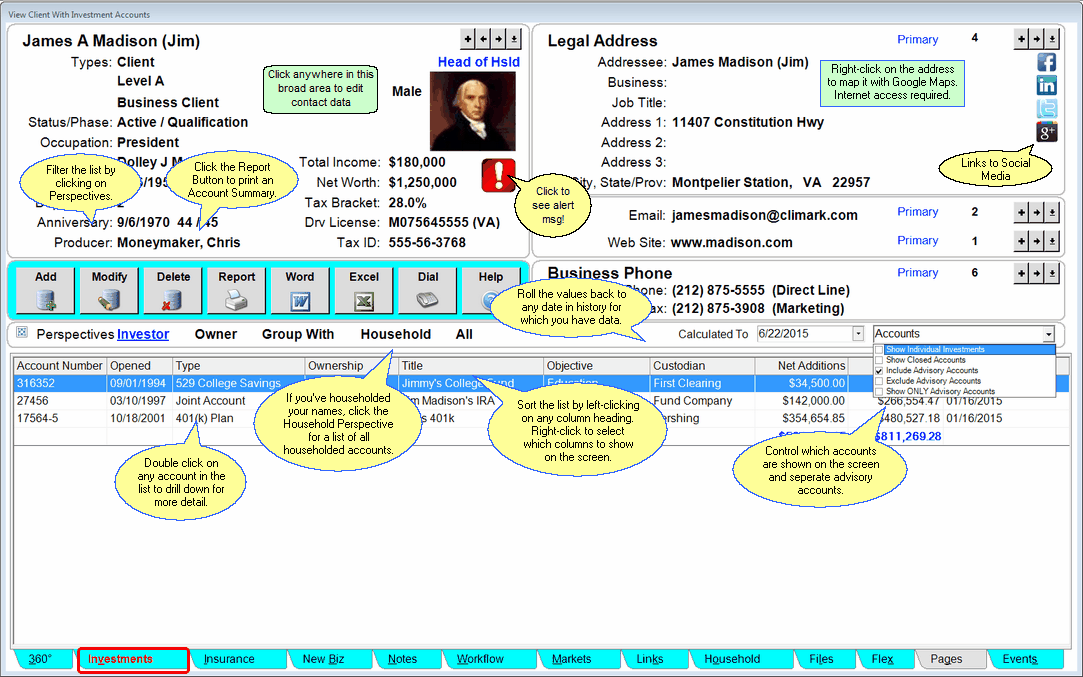
Using The View Client With Investment Accounts Screen
This View Screen is the primary point of entry for your client's investments. From here you can do any of the following:
•Change the valuation date (Calculated To) for all subsequent views of your clients by clicking on the date just above the list.
•Expand the list to see all of the individual investments by checking the Show Individual Investments Box next to the Calculated Date.
•As with every View Screen in Advisors Assistant, you can left-click on the column titles to sort the investments by that column. A single click will sort the column in ascending order, and another click will sort the column in descending order. Advisors Assistant will keep your View Screen sorted in this order until you change it. Each User in Advisors Assistant can sort their accounts and investments by a different column.
•Right-click on any column title to select which columns to show on the screen.
•Right-click the address on the screen to map it using Google Maps.
•Export the list to Excel (both summary or expanded) by clicking on the Excel Button.
•Print a summary of the accounts by clicking the Quick Report Button.
To see more information about any account, double click on the account from the list. You will then "drill down" to the next set of account screens.
•Instead of showing contact information in the top half of the screen, details about that account are shown.
•The Tabs across the bottom of the screen will change, to allow you to track additional information about that account.
•Advisors Assistant remembers the last Account View Screen you were sitting on when you last viewed the account screens, and that is the screen that will open when you return.
•Each View Screen for the account has its own Help, explaining the details about that particular screen.
Alert Icon ![]()
The Alert Icon indicates that there is an important note that should be read before contacting the client. Click on it to read the note. For information on how to set up the Alert Notes, click HERE.
Links To Social Media
You can link directly to your client's social media pages by clicking on one of the icons in the address block. If the icon is in color, then there is an address stored for that link. If the icon is grayscale, there is no address. On the screen above, Google+ does not have a link.
For more information about how to put in the address, click HERE.
Investment Perspectives
Perspectives allow you to view the information on the current View Screen in different ways. The View Client With Investment Accounts Screen can have up to 3 Perspectives.
Lists the accounts that are owned by the client name you are viewing.
Lists the accounts for which this client is the investor.
Lists all of the investments for which this client is listed as a "group with" name.
Show investment accounts which are associated with an members of the household for which the contact being viewed is the head of household.
All
Lists all accounts for the list above.
Accounts Drop Down
Click on the Accounts Field to drop down a list which will allow you to control which accounts are shown and separate advisory accounts from non-advisory accounts.

Check off the accounts you want to show
The list is smart enough to uncheck any boxes that don't make sense when you check other boxes.
![]() Expanding Your Lists
Expanding Your Lists
If the list in the bottom half of the View Screen is too long to fit on the screen, you can expand the list by clicking on the List Expander Button (![]() ) located in the bottom right corner of every View Screen.
) located in the bottom right corner of every View Screen.
Right Click Menus
You can right click on any item in the list at the bottom of the screen. Access to other web sites, such as DST Vision, TD Ameritrade and Pershing NetX 360 are controlled on the System Preferences and User Preferences Screens.
Adding and Modifying Investment Accounts
•To Add a new Investment Account, click on the Add Action Button in the middle of the screen. The Add Account Information Screen will open. You can also right click in the list or the open area below the list.
•To Modify an existing account, highlight the account in the list and click on the Modify Action Button in the middle of the screen. You can also double click on the account to open the Account View Screens, then click in the top half of the View Account Screen to edit that account. You can also right click on the account in the list.
•More details about Adding and Modifying Accounts is available in the Add/Modify Investment Accounts Help.
Adding Names to Advisors Assistant
You can add a name quickly and easily to Advisors Assistant at any time. To add a name to Advisors Assistant, click the Plus Button (![]() ) to the right of the current name you're viewing on the View Client Screen. To avoid adding duplicate names we recommend you look the name up first by opening the Name Lookup Screen. For more help about adding names, please see the Add/Modify Names help topic.
) to the right of the current name you're viewing on the View Client Screen. To avoid adding duplicate names we recommend you look the name up first by opening the Name Lookup Screen. For more help about adding names, please see the Add/Modify Names help topic.
There are two ways of combining the individual investments to arrive at the Rate of Return (ROR) for an account or portfolio for time weighted ROR.
The method of arriving at the Account Level used for the view screens differs from the method used for reports. Both methods are legitimate calculations.
Aggregation Method On View Screens
Aggregation is a method that is similar to calculating a weighted average of the returns of the individual investments. The account level is calculated based on the size of the investment and the length of time it was in the portfolio during the calculation period.
The advantage is that the Aggregation method does not require as much information as the calculation method. You do not need to have a price on file for every investment in the portfolio for every time there is a cash flow in any investment. This greatly speeds the transition from screen to screen.
The disadvantage only occurs rarely. Certain sequential transactions which move funds from one investment to another (closing one investment and opening another) can produce confusing results in time weighted returns using the aggregation method.
For example: Suppose you are calculating the rate of return over a two year period. Investment #1 grows 50% for the first year and is liquidated. The entire amount is then invested in investment #2 for the second year and it grows 50%. Since each investment grew 50% over half the reporting period, aggregating the returns will produce a 50% return. Using the Calculation Method, this would produce a 125% return.
Calculation Method On Reports
The Calculation Method is used for reports. It looks at the group of investments in the account or portfolio like one investment and recalculates the entire rate of return for each period between each cash flow.
The advantage to this method produces less distortion for large gains over short periods of time. In the example above, a rate of return of 125% would be calculated.
The disadvantage to the recalculating the entire rate of return is that the system must value the account any time there is a cash flow in the account. This means that there should be a price on file for every investment in the portfolio on any day there is a buy or sell for any investment in the portfolio. This requires much more calculation time to move from one client to another because it could require thousands of records to be read from the database.
This means that the screen ROR will usually be slightly different from the ROR shown or reports. The example above is an extreme example. The screen is more of an approximation than the reports, but it is an accepted, legitimate calculation.
See Also
Risk Analysis (MacroRisk Analytics)
Adding Account Custodian Information To The Report
|
By clicking on the Show Individual Investments check box near the right middle of the screen, you can expand the list and then export that entire list of investments to Excel. |